Le LPVS a présenté plusieurs projets de recherche au cours du congrès annuel de Vision Science Society, qui s’est déroulé à St. Pete Beach, en Floride, lors de la semaine du 17 au 22 mai 2019. Ce congrès de renommée internationale rassemble des chercheurs travaillant dans le domaine de la vision afin de faire progresser les connaissances scientifiques actuelles. Plusieurs disciplines liées à ce champ d’étude s’entrecoupent donc entre elles et le congrès vise à présenter les diverses avancées présentes au sein de chacune d’entre elles. Ces disciplines incluent la psychologie visuelle et perceptive, les neurosciences, la vision computationnelle et la psychologie cognitive. Les nombreuses séances de présentation d’affiches sont divisées en thèmes selon les sujets qui y sont présentés. Voici un aperçu des affiches présentées par notre laboratoire lors du congrès:
Séance d’affiche – Visages: Les procédés de traitement des traits faciaux
Right hemisphere horizontal tuning during face processing
Justin Duncan1,2, Guillaume Lalonde-Beaudoin1, Caroline Blais1 , Daniel Fiset1;
1 Université du Québec en Outaouais, 2 Université du Québec à Montréal
Left visual field (LVF) superiority refers to greater face processing accuracy and speed, compared to faces presented in the right VF (e.g., Sergent & Bindra, 1981). It is generally attributed to right hemisphere dominance (e.g., Kanwisher et al., 1997), but few mechanisms have been proposed for this phenomenon (e.g., global/local or low/high spatial frequency processing differences). Recent forays in the face processing literature have however revealed a critical role for horizontal spatial orientations (e.g., Goffaux & Dakin, 2010; Pachai et al., 2013). In line with these results, we verified whether orientation tuning might differ across hemispheres. Thirty participants completed two tasks measuring tuning profiles with orientation bubbles (Duncan et al., 2017). The first task was a 10 AFC identification, to generate a reference profile. The second task introduced lateralized presentations. In this task, a filtered probe face half (one of ten familiar individuals) was presented to either the LVF or RVF, while the other side viewed an average face half (randomized across trials). A target was then presented bilaterally, and participants indicated whether the probe and target were the same person. Central fixation was enforced with eye tracking (M = 97.7%, SD = 3.1% compliant trials) during the probe presentation (60 ms). Classification images were generated to extract diagnostic orientations. The statistical threshold (Zcrit = 2.101, p < 0.05) was established with the Stat4CI toolbox (Chauvin et al., 2005). As expected, horizontals predicted the best accuracy in the reference task (Z = 3.38). This relationship was also observed for the LVF (Z = 3.45), but not for the RVF (Z = –1.92). These results provide novel evidence for right hemisphere horizontal tuning for faces.
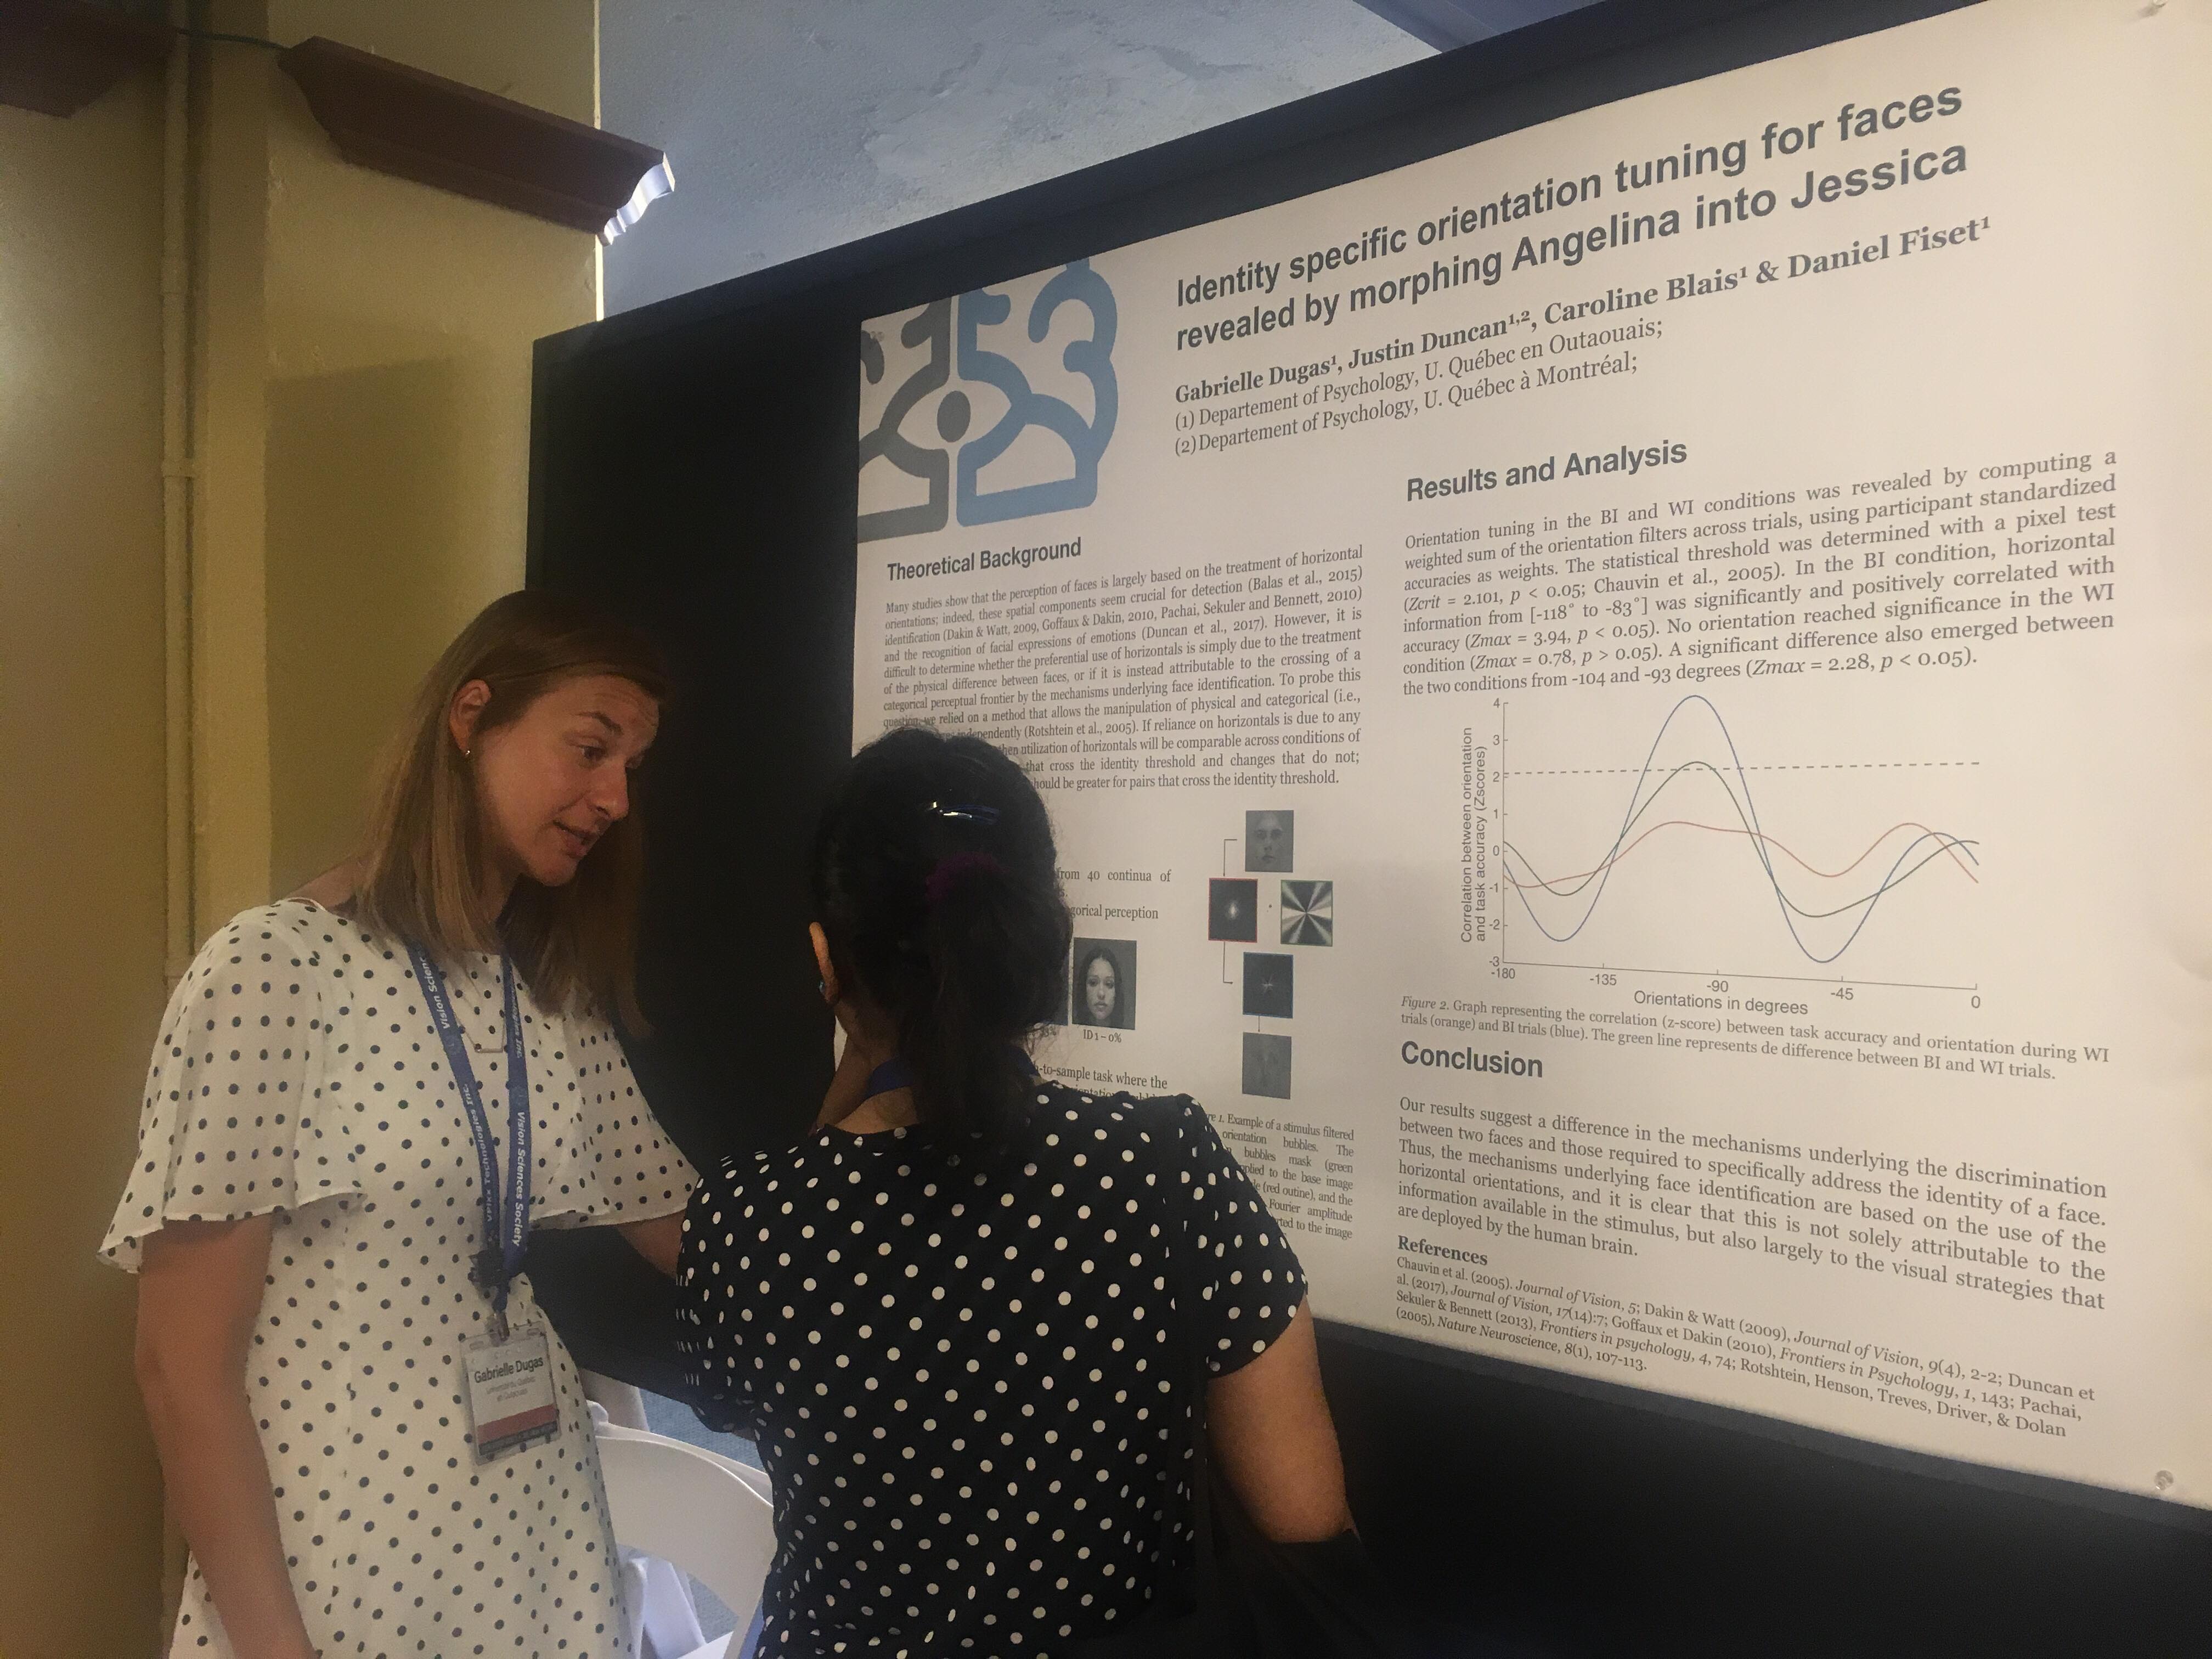
Identity specific orientation tuning for faces revealed by morphing Angelina into Jessica
Gabrielle Dugas1, Justin Duncan1,2, Caroline Blais1 , Daniel Fiset1;
1 Université du Québec en Outaouais, 2 Université du Québec à Montréal
Many recent studies have revealed that face recognition heavily relies on the processing of horizontal spatial orientations. However, most of those studies used tasks where it is difficult to dissociate the impact of physical face information from that of identity-specific information. To investigate this issue, we used a method designed to precisely control the physical difference between stimuli, and verified the horizontal tuning for faces of identical distances with regard to low-level properties but of different perceptual distance with regard to identity. Ten participants each completed 2,880 trials in a 2-ABX match-to-sample task. On each trial, the participants saw a target and two response alternatives, both sampled with the same orientation bubbles (Duncan et al., 2017). One response choice was visually identical to the sample (i.e. the correct response) whereas the other was either on the same side (within-identity [WI]) or on the other side (between-identity [BI]) of the categorical barrier. Thus, the physical distance between the target and the different (WI or BI) alternative was always the same, but the perceptual distance was not. As expected, WI trials were more difficult than BI trials for all participants, as indicated by the higher number of bubbles needed for the former (WI: M=101.66, SD=83.50) than the latter (BI: M=15.85, SD=14.94). Orientation tuning in the BI and WI conditions was revealed by computing a weighted sum of the orientation filters across trials, using participant accuracies as weights. In the BI condition, horizontal orientations between 62 and 101degres were significantly associated with accuracy (Zcrit=2.101; Zmax=4.25, p<0.05, peak at 84 degres); whereas no orientation reached the threshold in the WI condition (Zmax=1.41, p>0.05). Comparing horizontal tuning between the two conditions using a paired sample t test reveals an identity-specific horizontal tuning for faces, t(6) = 2.8, p < 0.05.
Séance d’affiche – Visages: Expressions faciales et discours
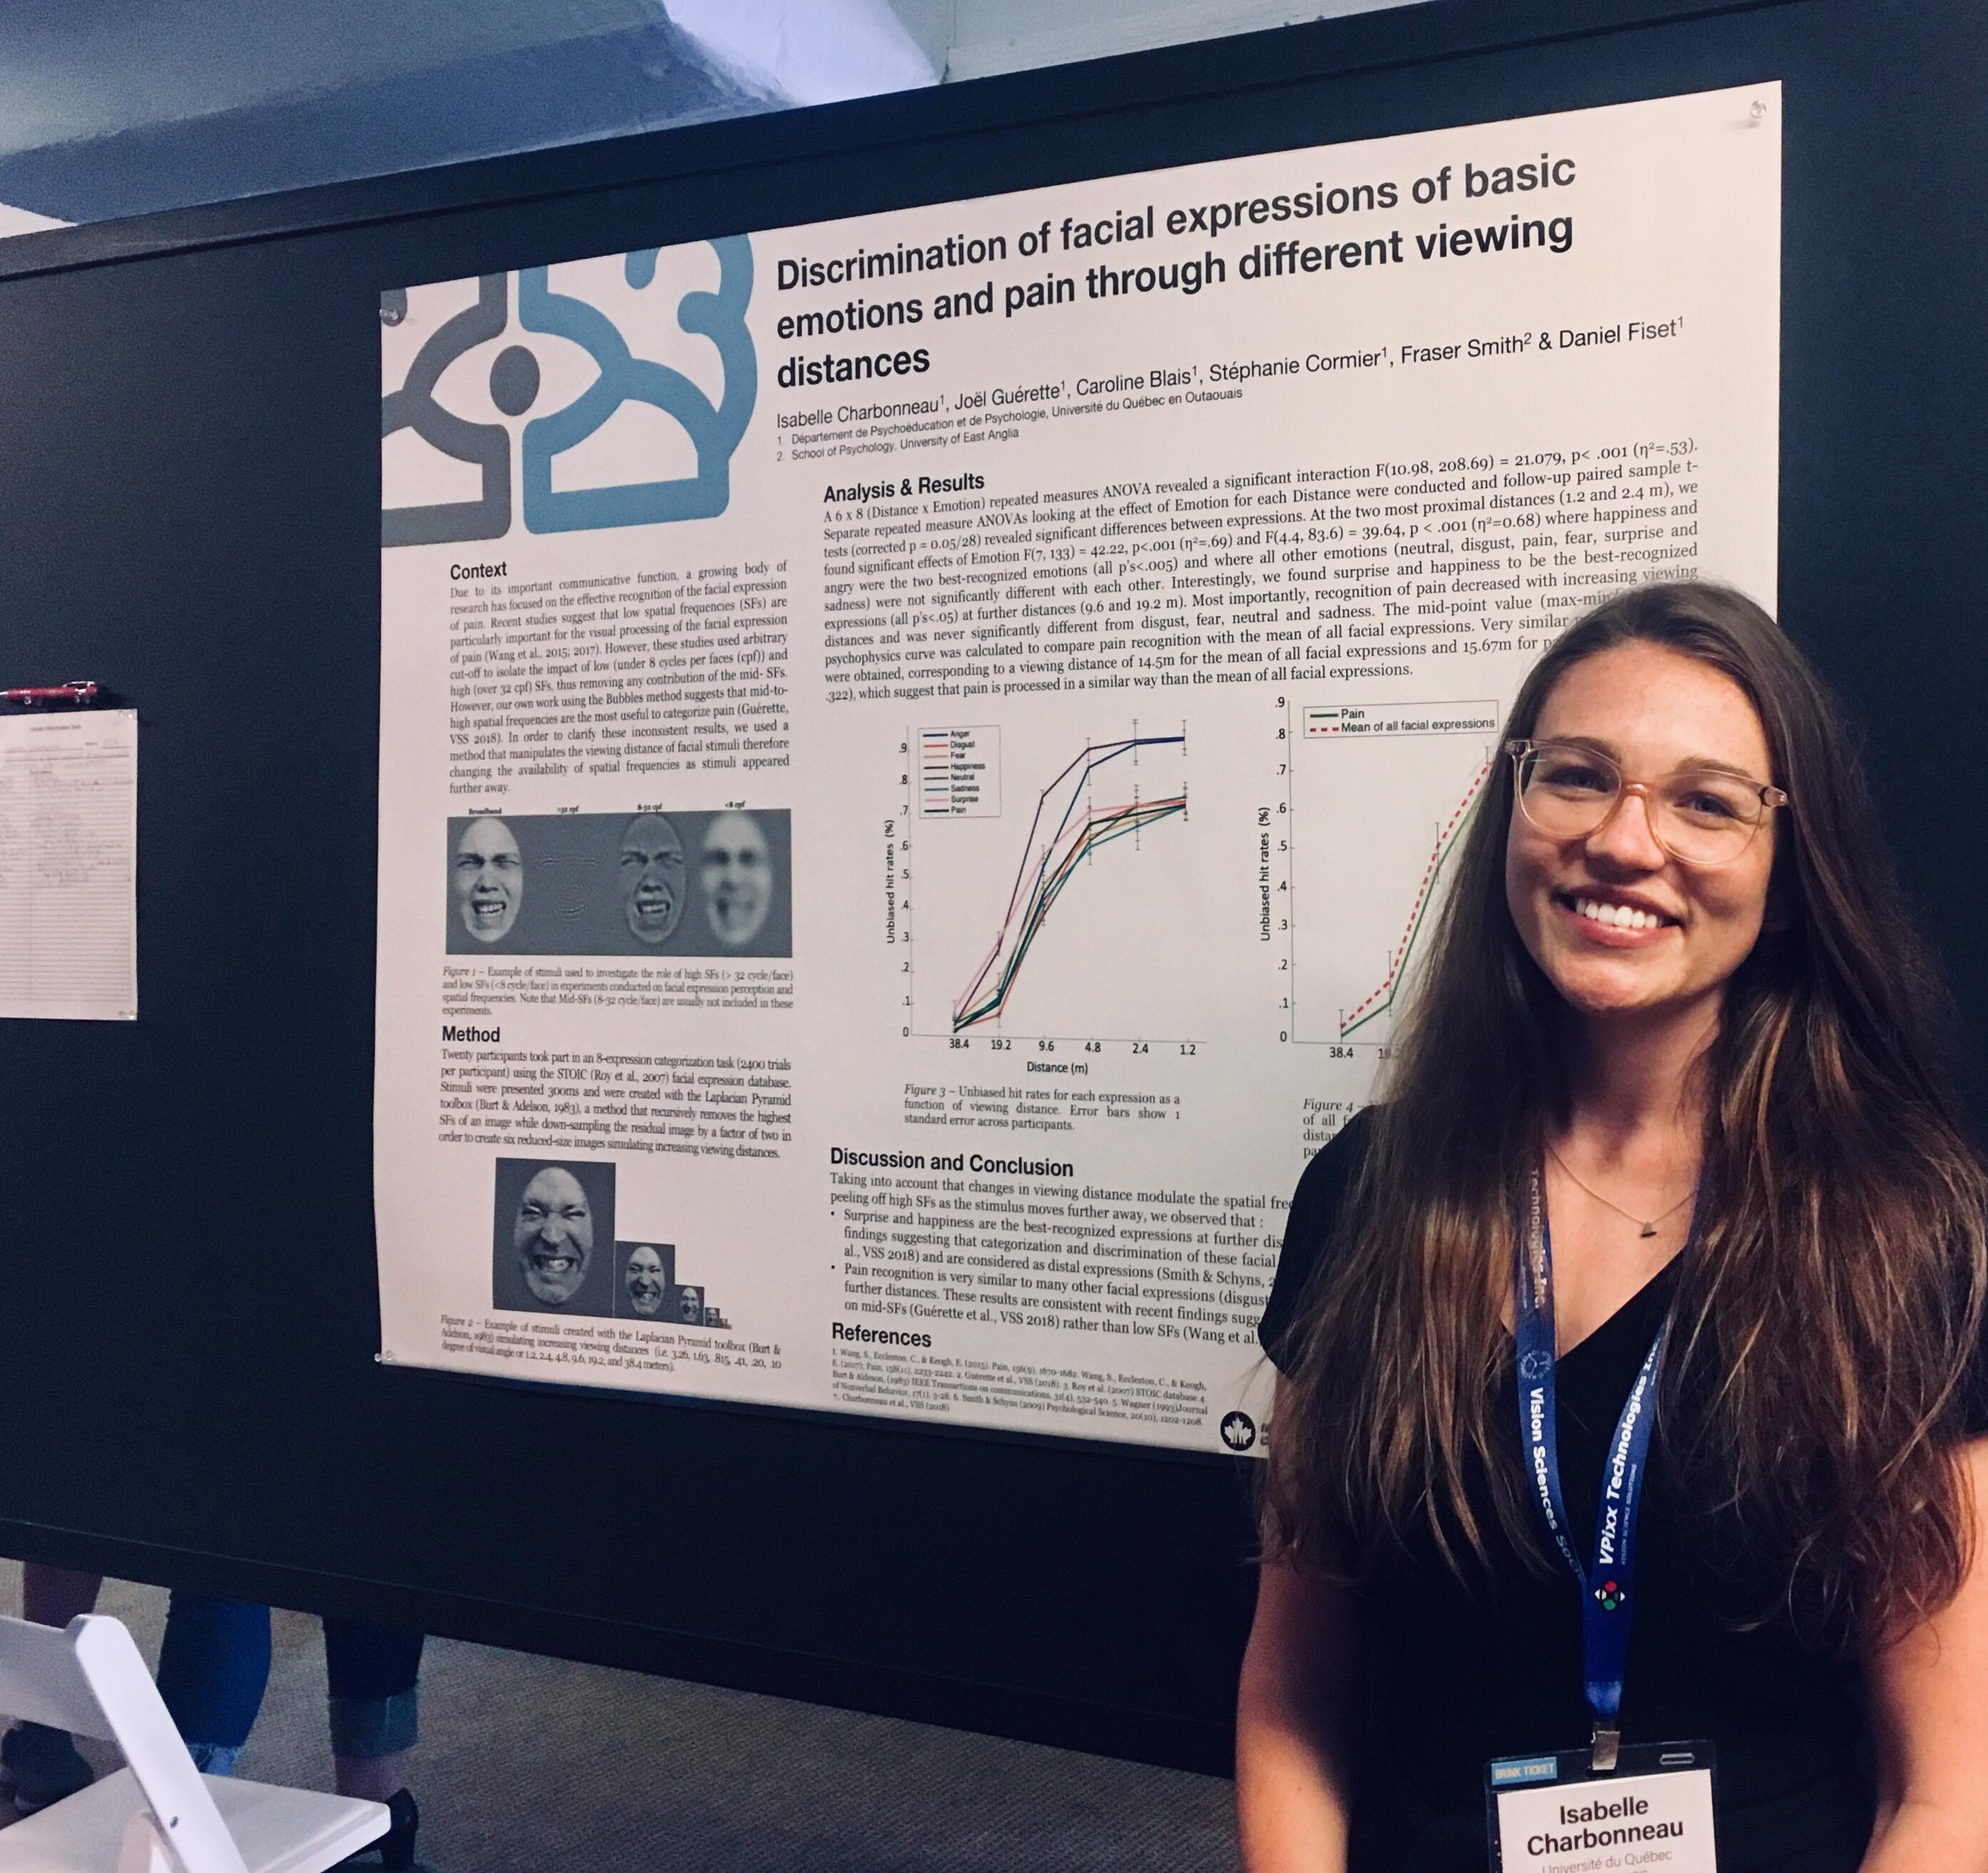
Discrimination of facial expressions and pain through different viewing distances
Isabelle Charbonneau1, Joël Guérette1 2, Caroline Blais1, Stéphanie Cormier1, Fraser Smith, Daniel Fiset1;
1 Université du Québec en Outaouais, 2 Université du Québec à Montréal
Due to its important communicative function, a growing body of research has focused on the effective recognition of the facial expression of pain. Here, we investigated how pain along with the basic emotions are recognized at different viewing distances. Sixteen participants took part in an 8-expression categorization task (2400 trials per participant). We used the Laplacian Pyramid toolbox (Burt & Adelson, 1983) to create six reduced-size images simulating increasing viewing distances (i.e. 3.26, 1.63, 0.815, 0.41, 0.20, 0.10 degree of visual angle). Unbiased hit rates (Wagner, 1993) were calculated to quantify the participants’ performance at each viewing distance. A 6 x 8 (Distance x Emotion) repeated measures ANOVA revealed a significant interaction F(8.54, 128.22) = 15.97, p < .001 (η2=0.516). Separate repeated measure ANOVAs looking at the effect of Emotion for each Distance were conducted and follow-up paired sample t-tests (corrected p = 0.05/28) revealed significant differences between expressions. At the most proximal distance, we found a significant effect of Emotion F(7,105)=21.41, p<.001 (η2=0.588) where happiness and angry were the two best-recognized emotions (all p’s<.005) followed by disgust, pain, fear, surprise and sadness. Interestingly, we found surprise and happiness to be the best-recognized expressions at further distances (all p’s<.05) which is consistent with previous findings (Smith & Schyns, 2009). Most importantly, recognition of pain decreased with increasing viewing distances and was not well recognized at the furthest distance. Taking into account that changes in viewing distance modulate the spatial frequency content available to an observer by progressively peeling off high SFs as the stimulus moves further away, these results are consistent with recent findings suggesting that pain categorization and discrimination rely mostly on mid-SFs (Guérette et al., VSS 2017).
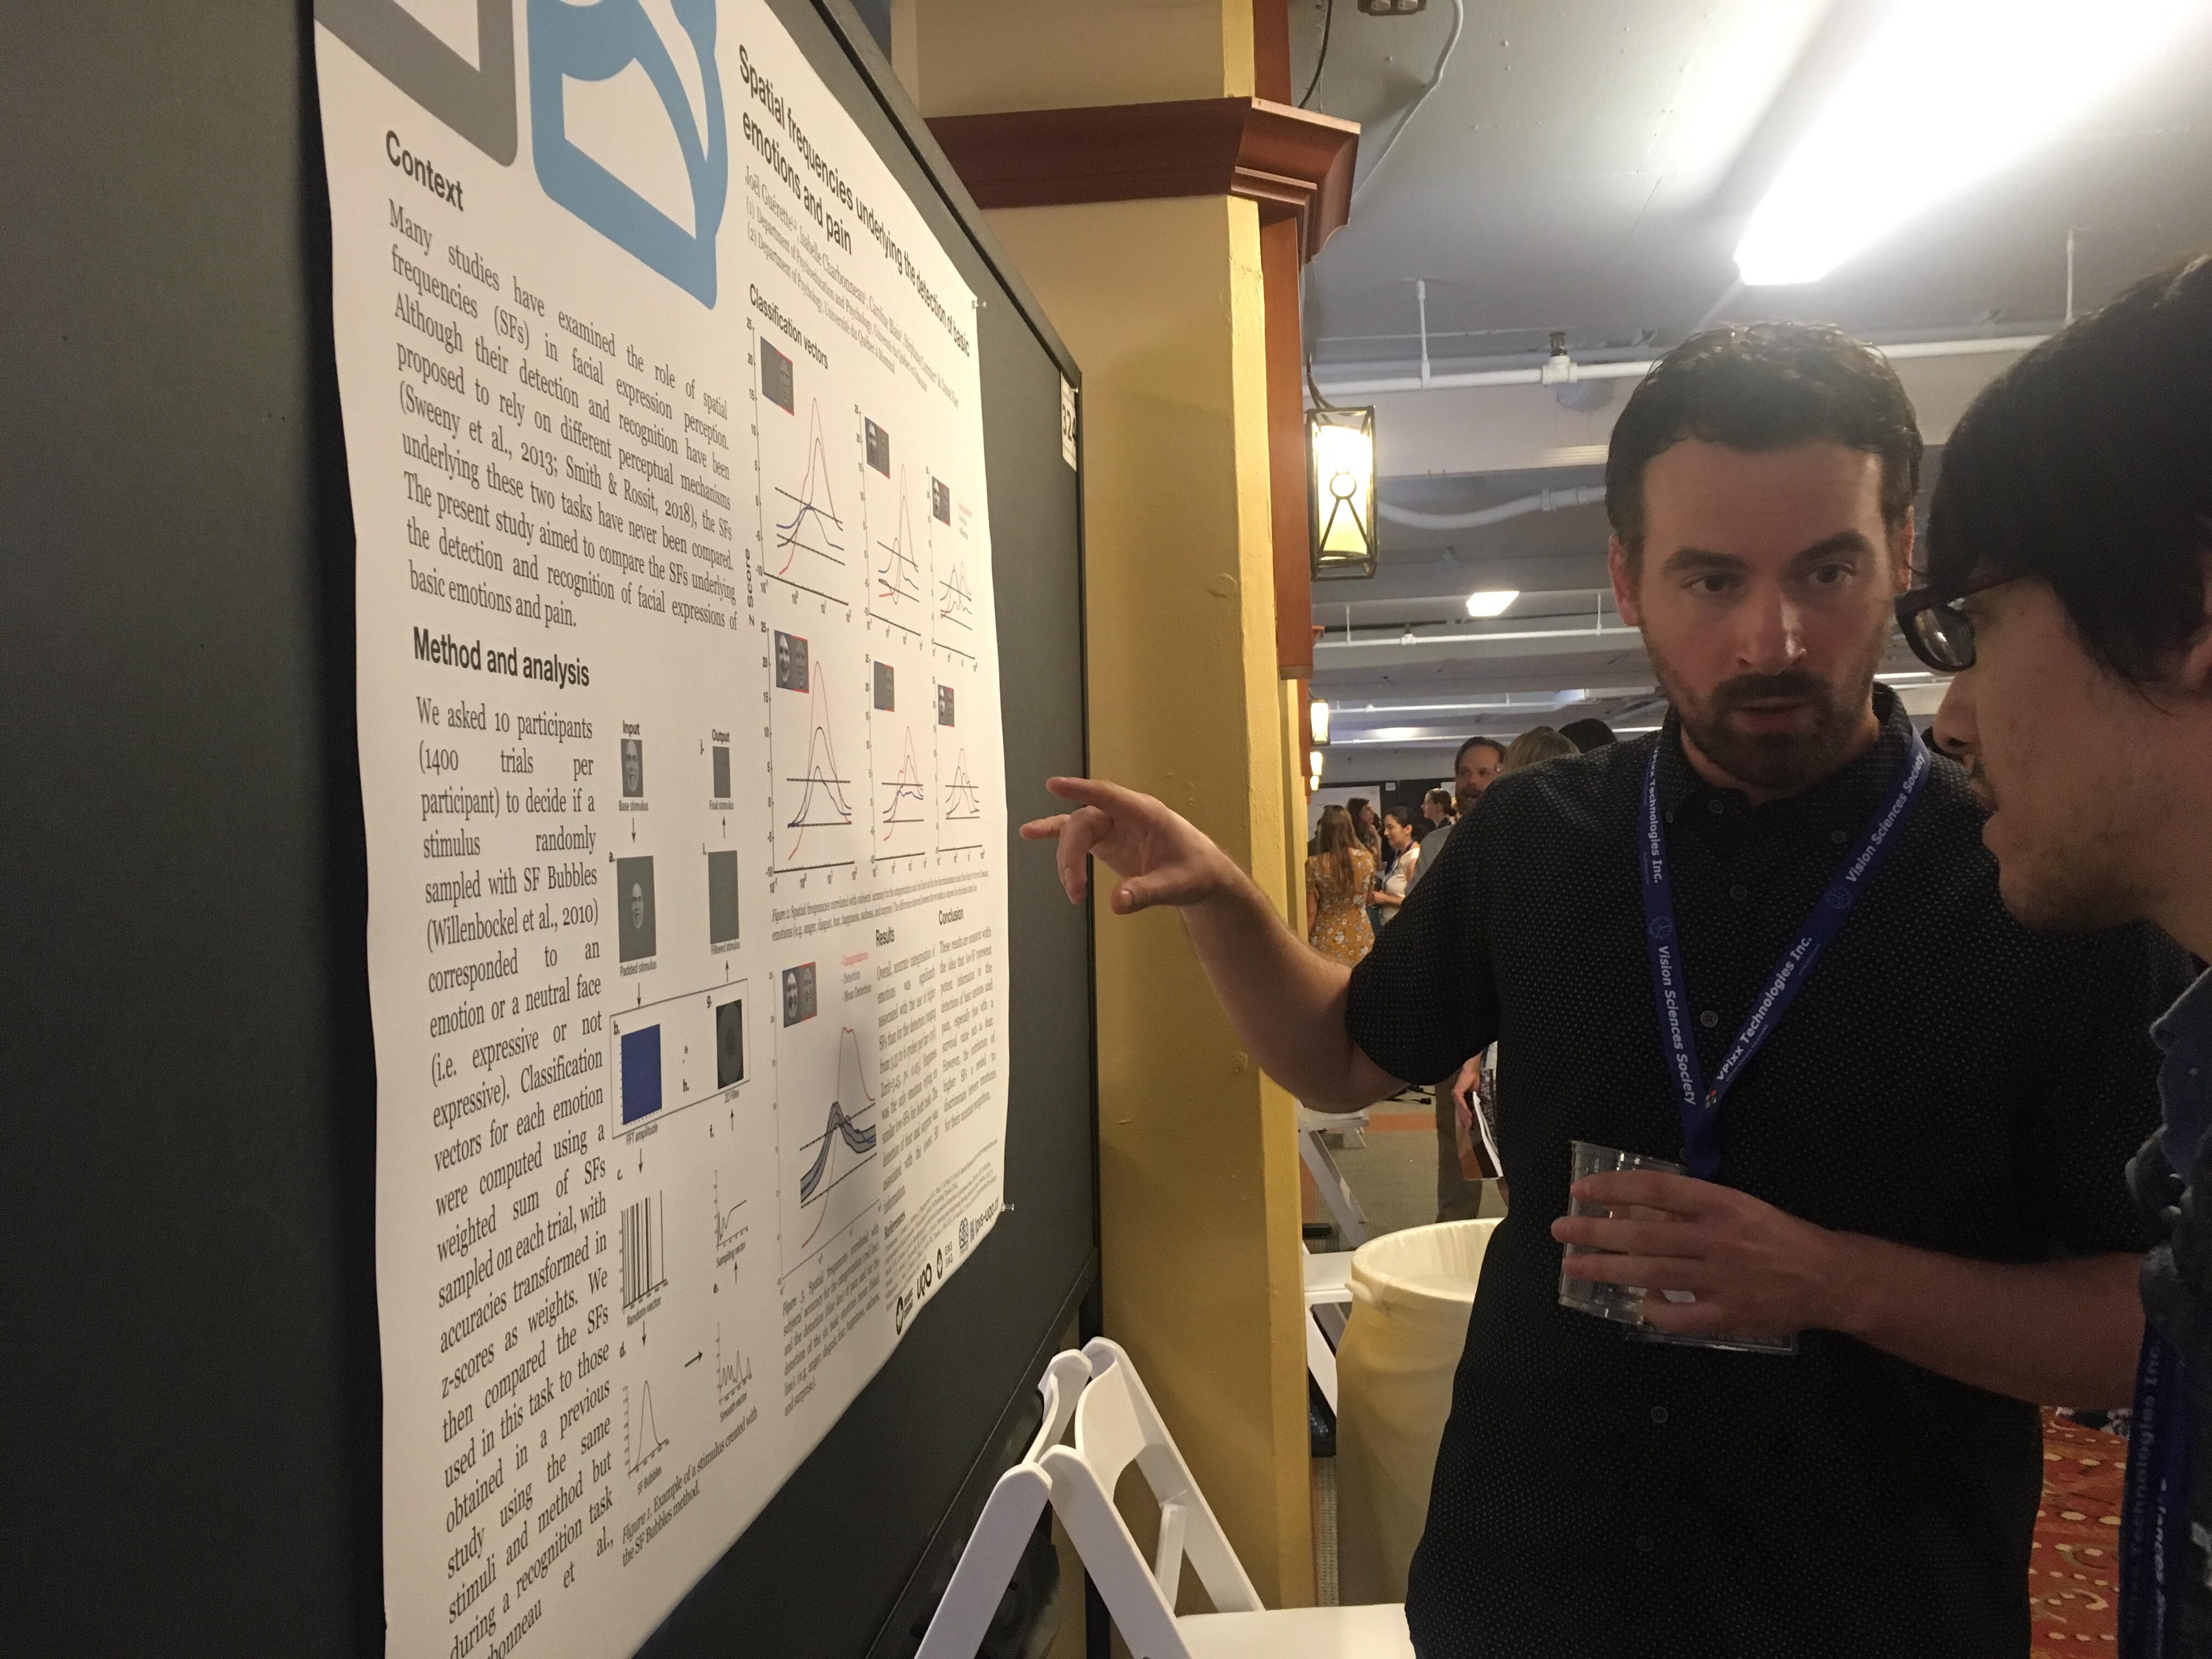
Spatial frequencies underlying the detection of basic emotions and painJoël Guérette1 2 , Isabelle Charbonneau1, Stéphanie Cormier1, Caroline Blais1, Daniel Fiset1;
1 Université du Québec en Outaouais, 2 Université du Québec à Montréal
Many studies have examined the role of spatial frequencies (SFs) in facial expression perception. However, although their detection and recognition have been proposed to rely on different perceptual mechanisms (Sweeny et al., 2013; Smith & Rossit, 2018), the SFs underlying these two tasks have never been compared. Thus, the present study aimed to compare the SFs underlying the detection and recognition of facial expressions of basic emotions and pain. Here, we asked 10 participants (1400 trials per participant) to decide if a stimulus randomly sampled with SF Bubbles (Willenbockel et al., 2010) corresponded to an emotion or a neutral face. Classification vectors for each emotion were computed using a weighted sum of SFs sampled on each trial, with accuracies transformed in z-scores as weights. We then compared the SFs used in this task to those obtained in a previous study using the same stimuli and method but during a recognition task (Charbonneau et al., 2018). Overall, accurate detection of emotions was significantly associated with the use of low-SFs (ranging from 3.33 to 6 cycles per face (cpf); Zcrit=3.45, p< 0.05). Happiness was the only emotion relying on similar low-SFs for both tasks. Other emotions were associated with the use of higher SFs in the recognition task. Interestingly, the detection of fear (ranging from 1.67 to 7 cpf, peaking at 4 cpf) and surprise (ranging from 1.33 and 6.33 cpf, peaking at 3.33 cpf) was associated with the lowest SF information. These results are consistent with the idea that low-SF represent potent information for the detection of emotions, especially those with a survival value such as fear. However, the contribution of higher SFs is needed to discriminate between emotions for their accurate recognition.
Séance d’affiche – Visages: Attention et différences individuelles
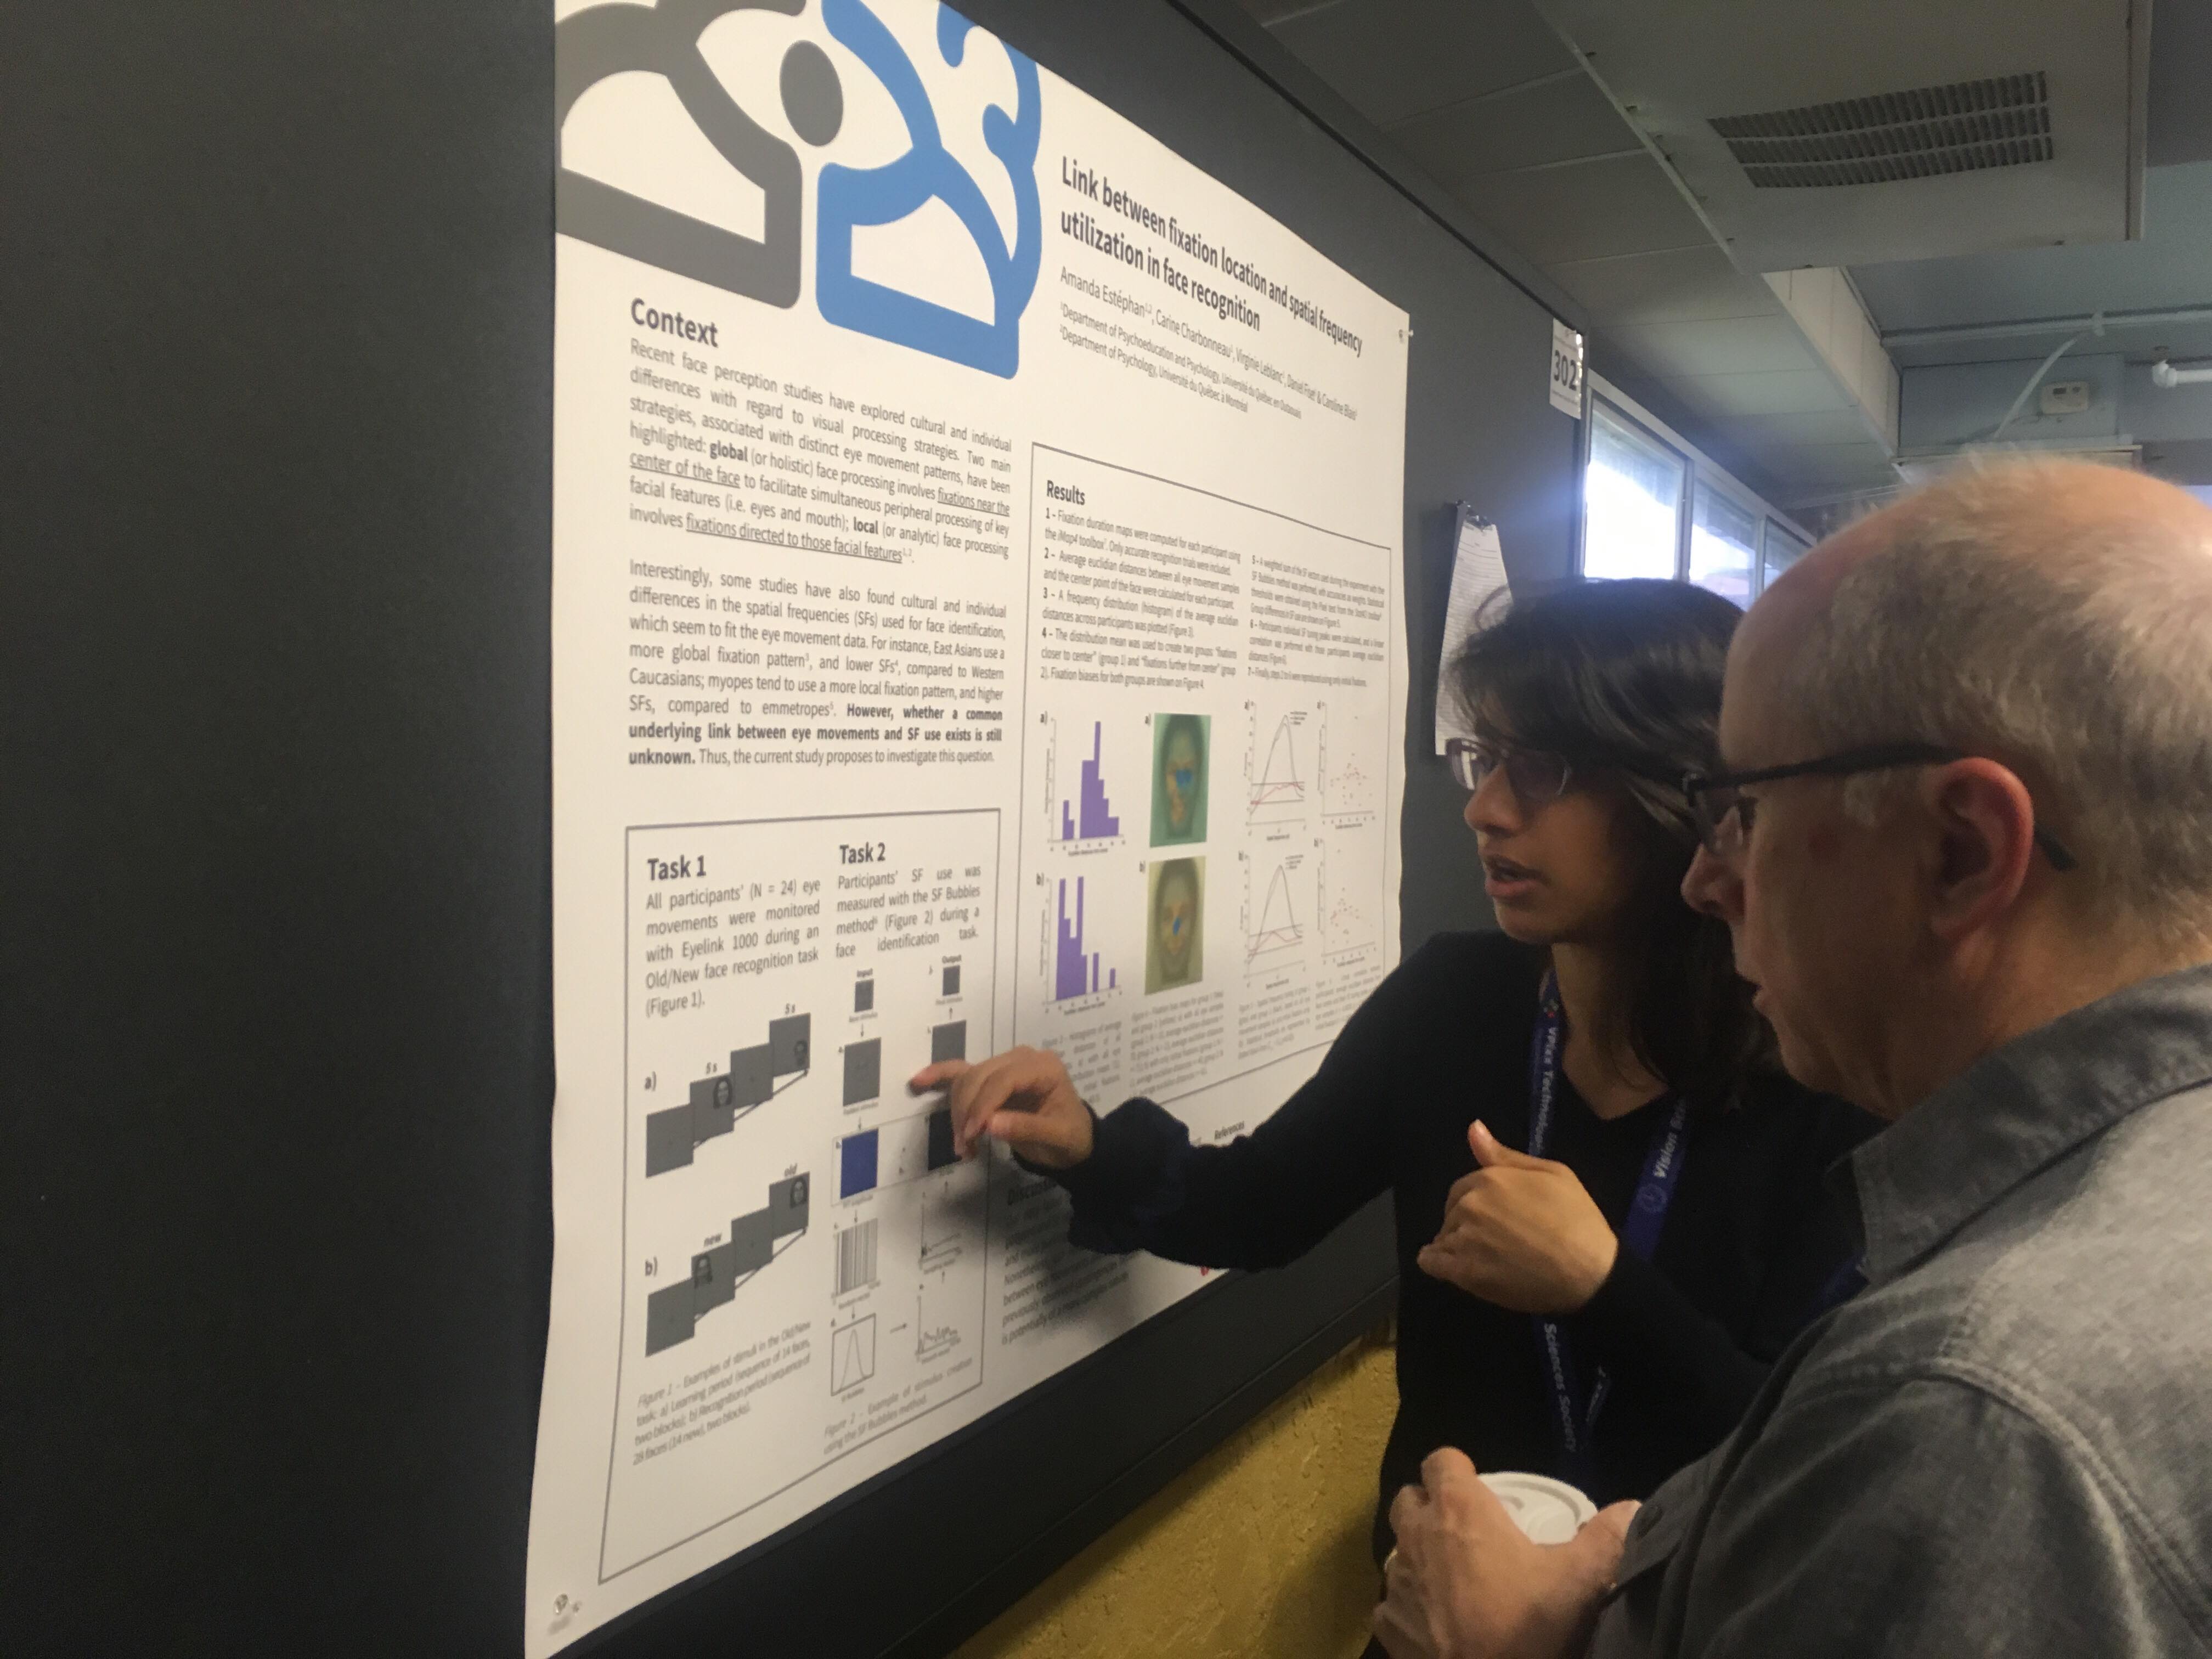
Link between initial fixation location and spatial fre- quency utilization in face recognition
Amanda Estéphan1,2, Carine Charbonneau1 , Virginie Leblanc1, Daniel Fiset1, Caroline Blais1;
1 Université du Québec en Outaouais, 2 Université du Québec à Montréal
Recent face perception studies have explored cultural and individual differences with regard to visual processing strategies. Two main strategies, associated with distinct eye movement patterns, have been highlighted: global (or holistic) face processing involves fixations near the center of the face to facilitate simultaneous peripheral processing of key facial features (i.e. eyes and mouth); local (or analytic) face processing involves fixations directed to those facial features (Chuk et al, 2014; Miellet et al, 2011). Interestingly, some studies have also found cultural and individual differences in the spatial frequencies (SFs) used for face identification, which seem to fit the eye movement data. For instance, East Asians use a more global fixation pattern (Blais et al, 2008), and lower SFs (Tardif et al, 2017), compared to Western Caucasians; myopes tend to use a more local fixation pattern, and higher SFs, compared to emmetropes (Estephan et al, 2018). However, whether a common underlying link between eye movements and SF use exists is still unknown. In order to investigate this question, the eye movements of 24 Canadian participants were monitored while they completed an Old/New face recognition task, and the SF Bubbles method (Willenbockel et al., 2010) was used to measure the same participants’ SF utilization during a face identification task. Fixation duration maps were computed for each participant using the iMap4 toolbox (Lao et al., 2017), and participants’ individual SF tuning peaks, obtained with SF Bubbles, were calculated. Group analyses based on participants’ initial fixation location were performed on SF tuning; correlations between initial fixation location and SF tuning peaks were also calculated. In sum, our data failed to reveal a clear link between eye movement patterns and SF utilization. However, these results are preliminary and more participants will be tested to increase statistical power. Nonetheless, our results highlight that the underlying relation between eye movements and SF use that could possibly drive the previously observed contingencies between these two measures is potentially of a more complex nature.
Séance d’affiche – Visages: Facteurs sociaux et culturels
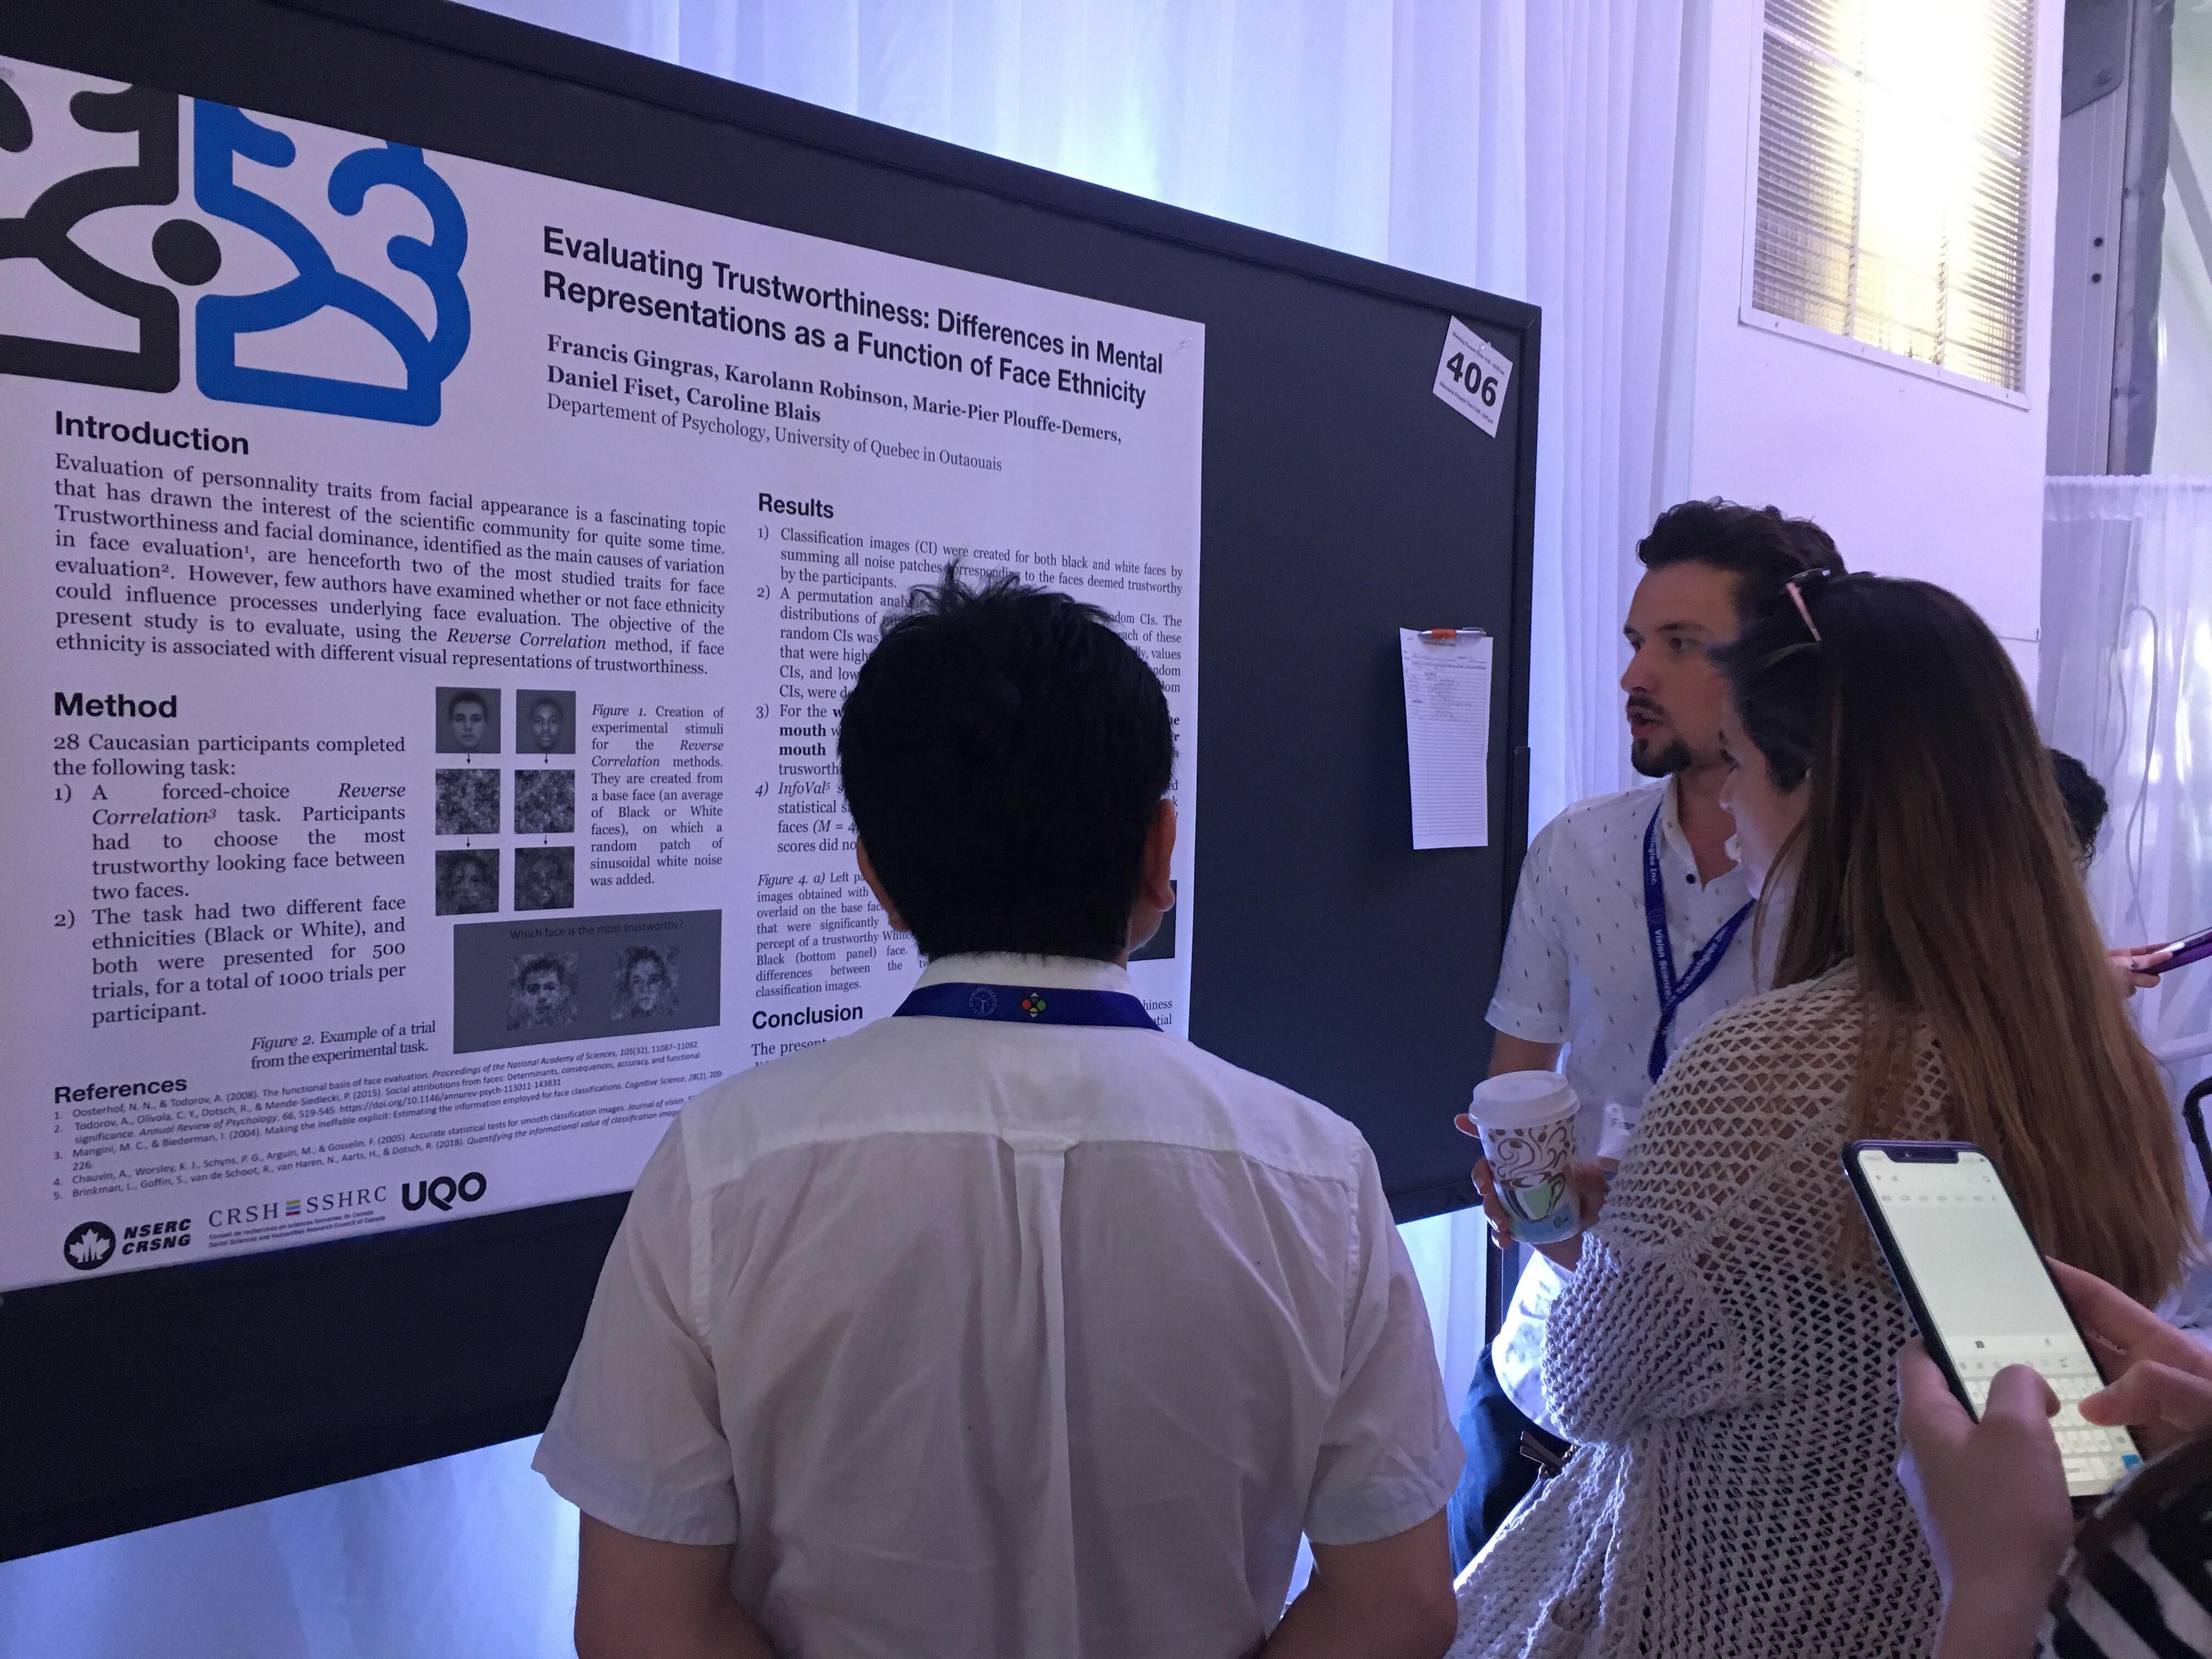
Evaluating Trustworthiness: Differences in Visual Rep- resentations as a Function of Face Ethnicity
Francis Gingras1, Karolann Robinson1, Daniel Fiset1, Caroline Blais1;
1 Université du Québec en Outaouais
Trustworthiness is rapidly and automatically assessed based on facial appearance, and it is one of the main dimensions of face evaluation (Oosterhof & Todorov, 2008). Few studies have investigated how we evaluate trustworthiness in faces of other ethnicities. The present study aimed at comparing how individuals imagine a trustworthy White or Black face. More specifically, the mental representations of a trustworthy White and Black face were measured in 30 participants using a Reverse Correlation task (Mangini & Biederman, 2004). On each trial (N=500 per participant), two stimuli, created by adding sinusoidal white noise to an identical base face (White or Black, depending on the experimental condition), were presented side-by-side. The participant’s task was to decide which of the two looked most trustworthy. The noise patches corresponding to the chosen stimuli were summed to produce a classification image, representing the luminance variations associated with a percept of trustworthiness. A statistical threshold was found using the Stat4CI’s cluster test (Chauvin et al., 2005), a method that corrects for the multiple comparisons across all pixels while taking into account the spatial dependence inherent to coherent images (tcrit=3.0, k=246, p<0.025). Results show that for a White face, perception of trustworthiness is associated with a lighter eye region; for a Black face, perception of trustworthiness is associated with a darker right eye and a lighter mouth. Statistically comparing both classification images (tcrit=3.0, k=246, p<0.025) revealed that the eye region was more important in judging trustworthiness of White faces, while the mouth region was more important for Black faces. The present study shows that facial traits used to form the mental representation of trustworthiness differ with face ethnicity. More research will be needed to verify if this finding generalizes across populations of different ethnicities.
Variation of empathy in viewers impacts facial features encoded in their mental representation of pain expression.
Marie-Pier Plouffe-Demers1 2 , Camille Saumure1, Daniel Fiset1 , Stéphanie Cormier1 , Miriam Kunz3 , Caroline Blais1;
1 Université du Québec en Outaouais, 2 Université du Québec à Montréal, 3 University of Groningen
The impact of gender on visual strategies underlying the discrimination of facial expressions of pain
Camille Saumure1, Marie-Pier Plouffe-Demers1 2, Daniel Fiset1 , Stéphanie Cormier1 , Miriam Kunz3 , Caroline Blais1;
1 Université du Québec en Outaouais, 2 Université du Québec à Montréal, 3 University of Groningen
Previous studies have found a female advantage in the recognition/detection (Hill and Craig, 2004; Prkachin et al., 2004) of pain expressions, although this effect is not systematic (Simon et al., 2008; Riva et al., 2011). However, the impact of gender on pain expression recognition visual strategies remains unexplored. In this experiment, 30 participants (15 males) were tested using the Bubbles method (Gosselin & Schyns, 2001), which randomly sampled facial features across five spatial frequency (SF) bands to infer what visual information was successfully used. On each of the 1,512 trial, two bubblized faces, sampled from 8 avatars (2 genders; 4 levels of pain intensity), were presented to participants who identified the one expressing the highest pain level. Three difficulty levels, determined by the percentage of pain difference between the two stimuli (i.e 100%, 66% or 33%) were included. Number of bubbles needed to maintain an average accuracy of 75% was used as a performance measure (Royer et al., 2015). Results indicated a trend towards a higher number of bubbles needed by male (M=57.7, SD=30.4) in comparison to female (M=40.2, SD=23.2), [t(28)=2.02, p=0.05]. Moreover, this difference was significant with the highest level of difficulty [t(28)=2.22, p=0.04], suggesting that pain discrimination was more difficult for male (M=77.6, SD=36.8) than female (M=52.3, SD=24.5). Classification images, generated by calculating a weighted sum of the bubbles position (where accuracies transformed in z-scores were used as weights), revealed that female made a significantly higher use of the lowest band of SF (Zcrit = 2.7, p<0.05; 5.4-2.7 cycles per face). These results suggest that gender impacts the performance and the visual strategies underlying pain expression recognition.